Cross-section
This tool allows you to create a plane on the map to view a cross-section of a 3D dataset. This way, you can visualize and interact with the data in a 2D view, including creating measurements. This can provide deeper insight into the internal structure of your data.
How to create a Cross-section
- Identify the chosen 3D data: Navigate to the data you want to take a cross-section of by panning the map or fitting on your Publication. You might need to tilt the camera for a better initial visual.
- Activate the cross-section tool: Click the
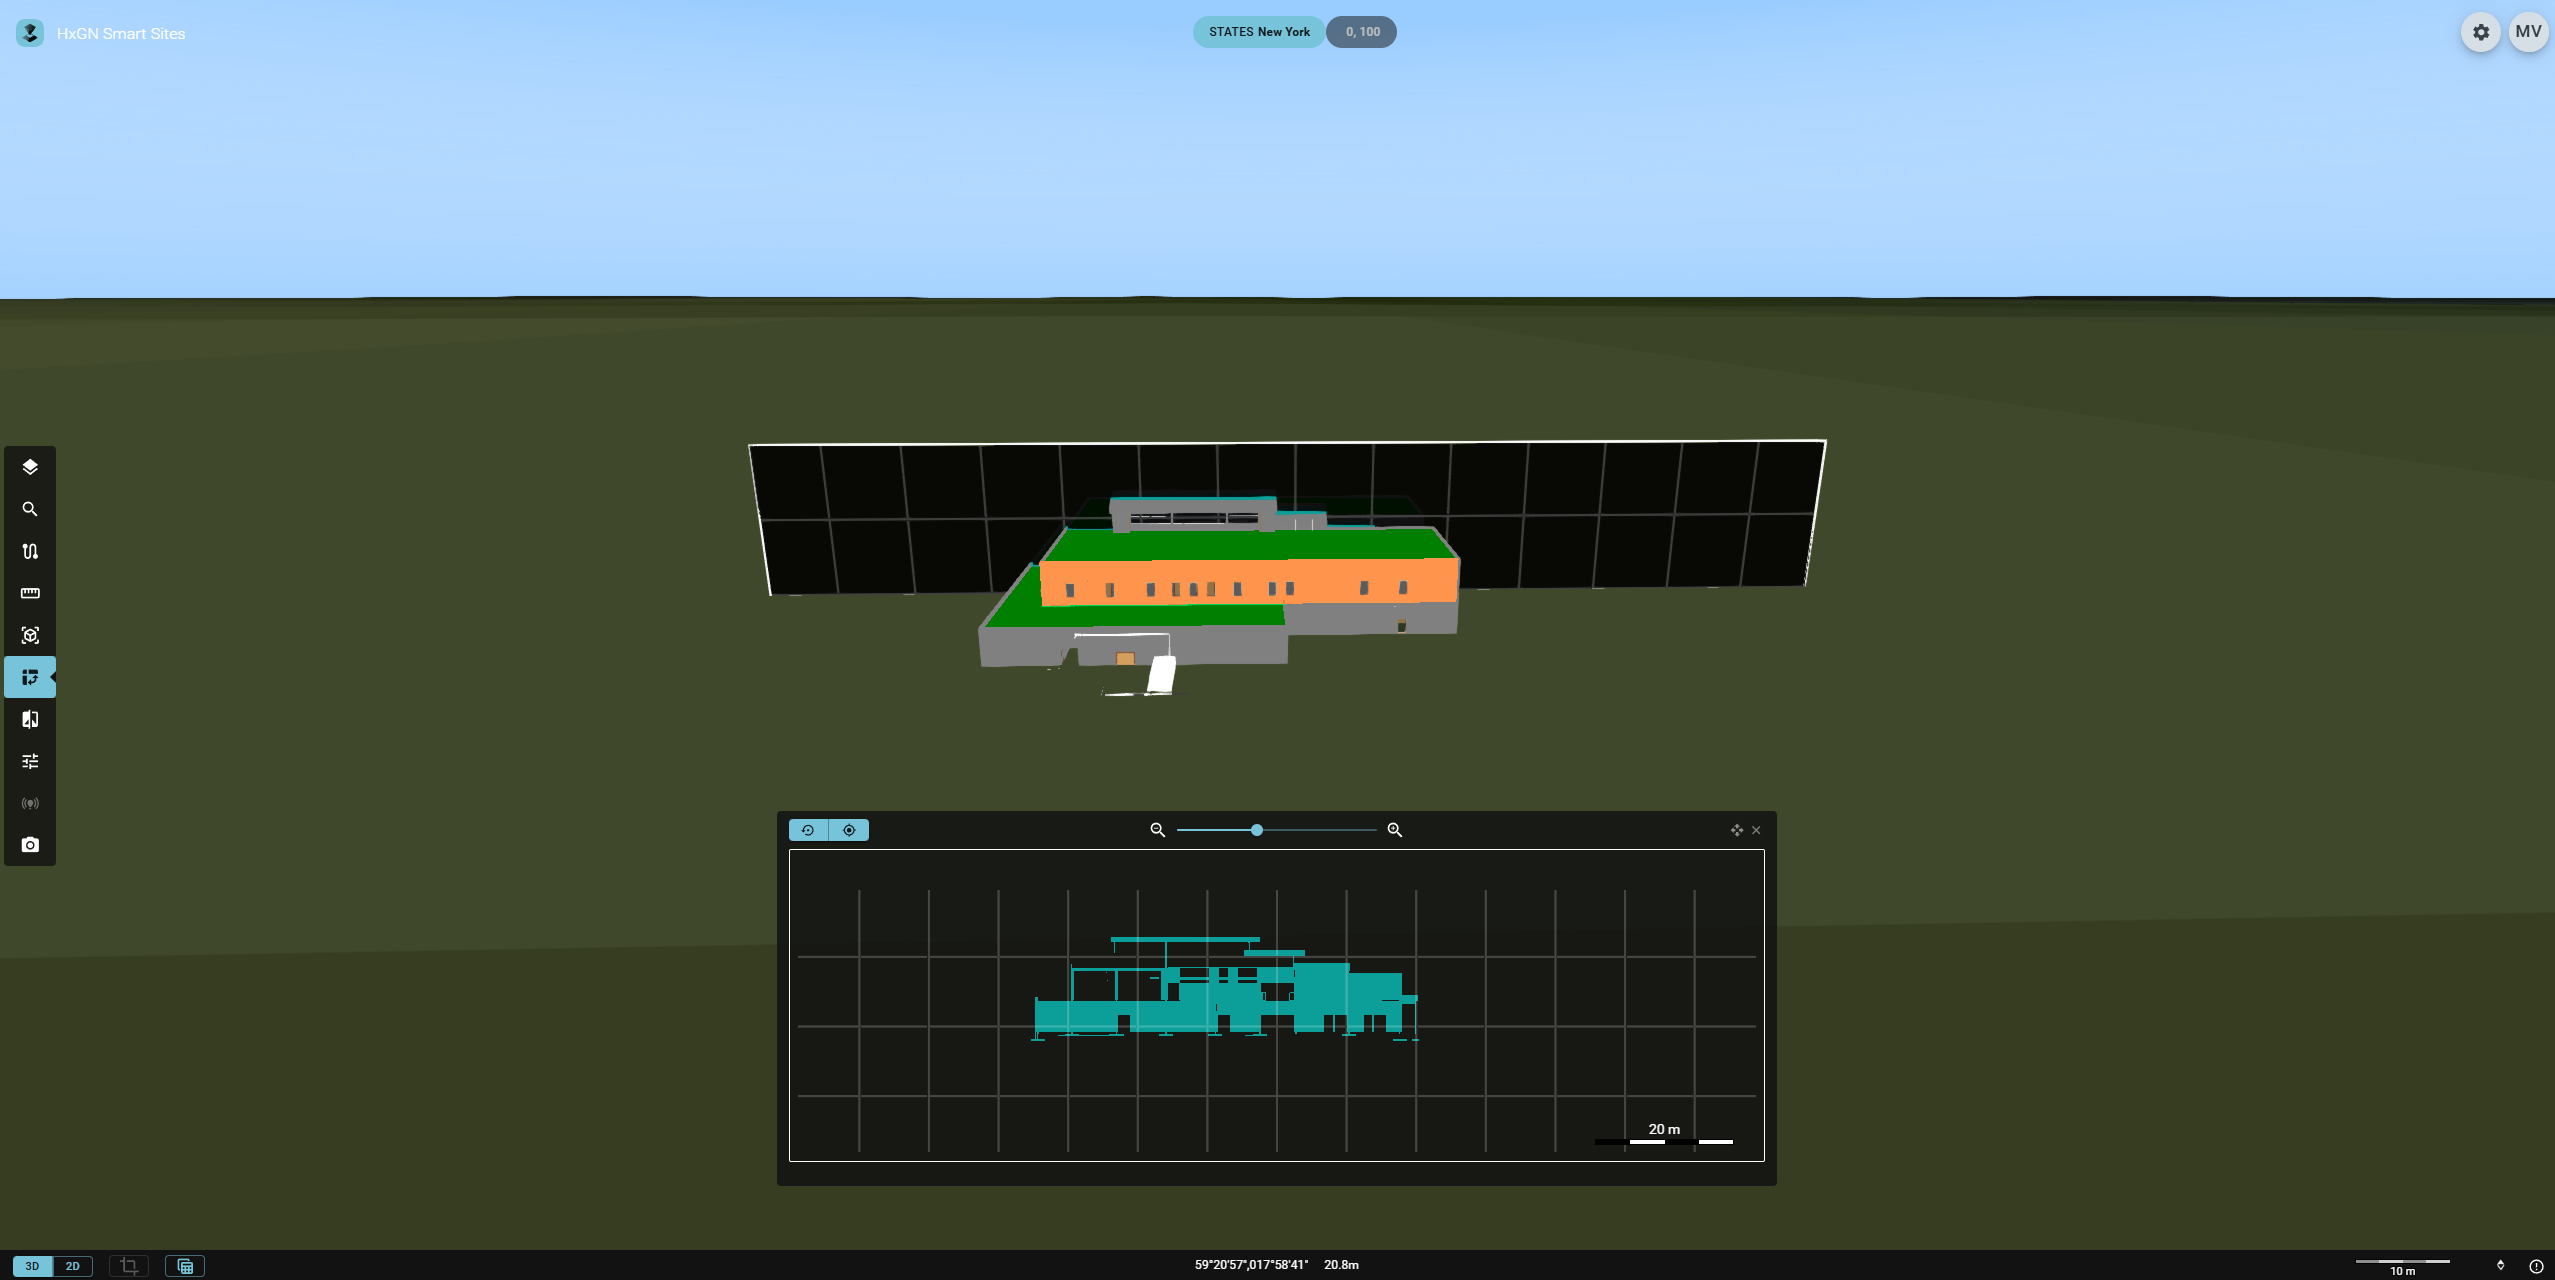
Cross-sectionicon in the Toolbar. A new cross-section view appears, which at first shows no data. - Create a cross-section: Click the map and move the mouse to create a cross-section plane. You may afterward still move the plane using its controls.
- Select a publication: Use the drop-down field to select the publication you are viewing in the cross-section.
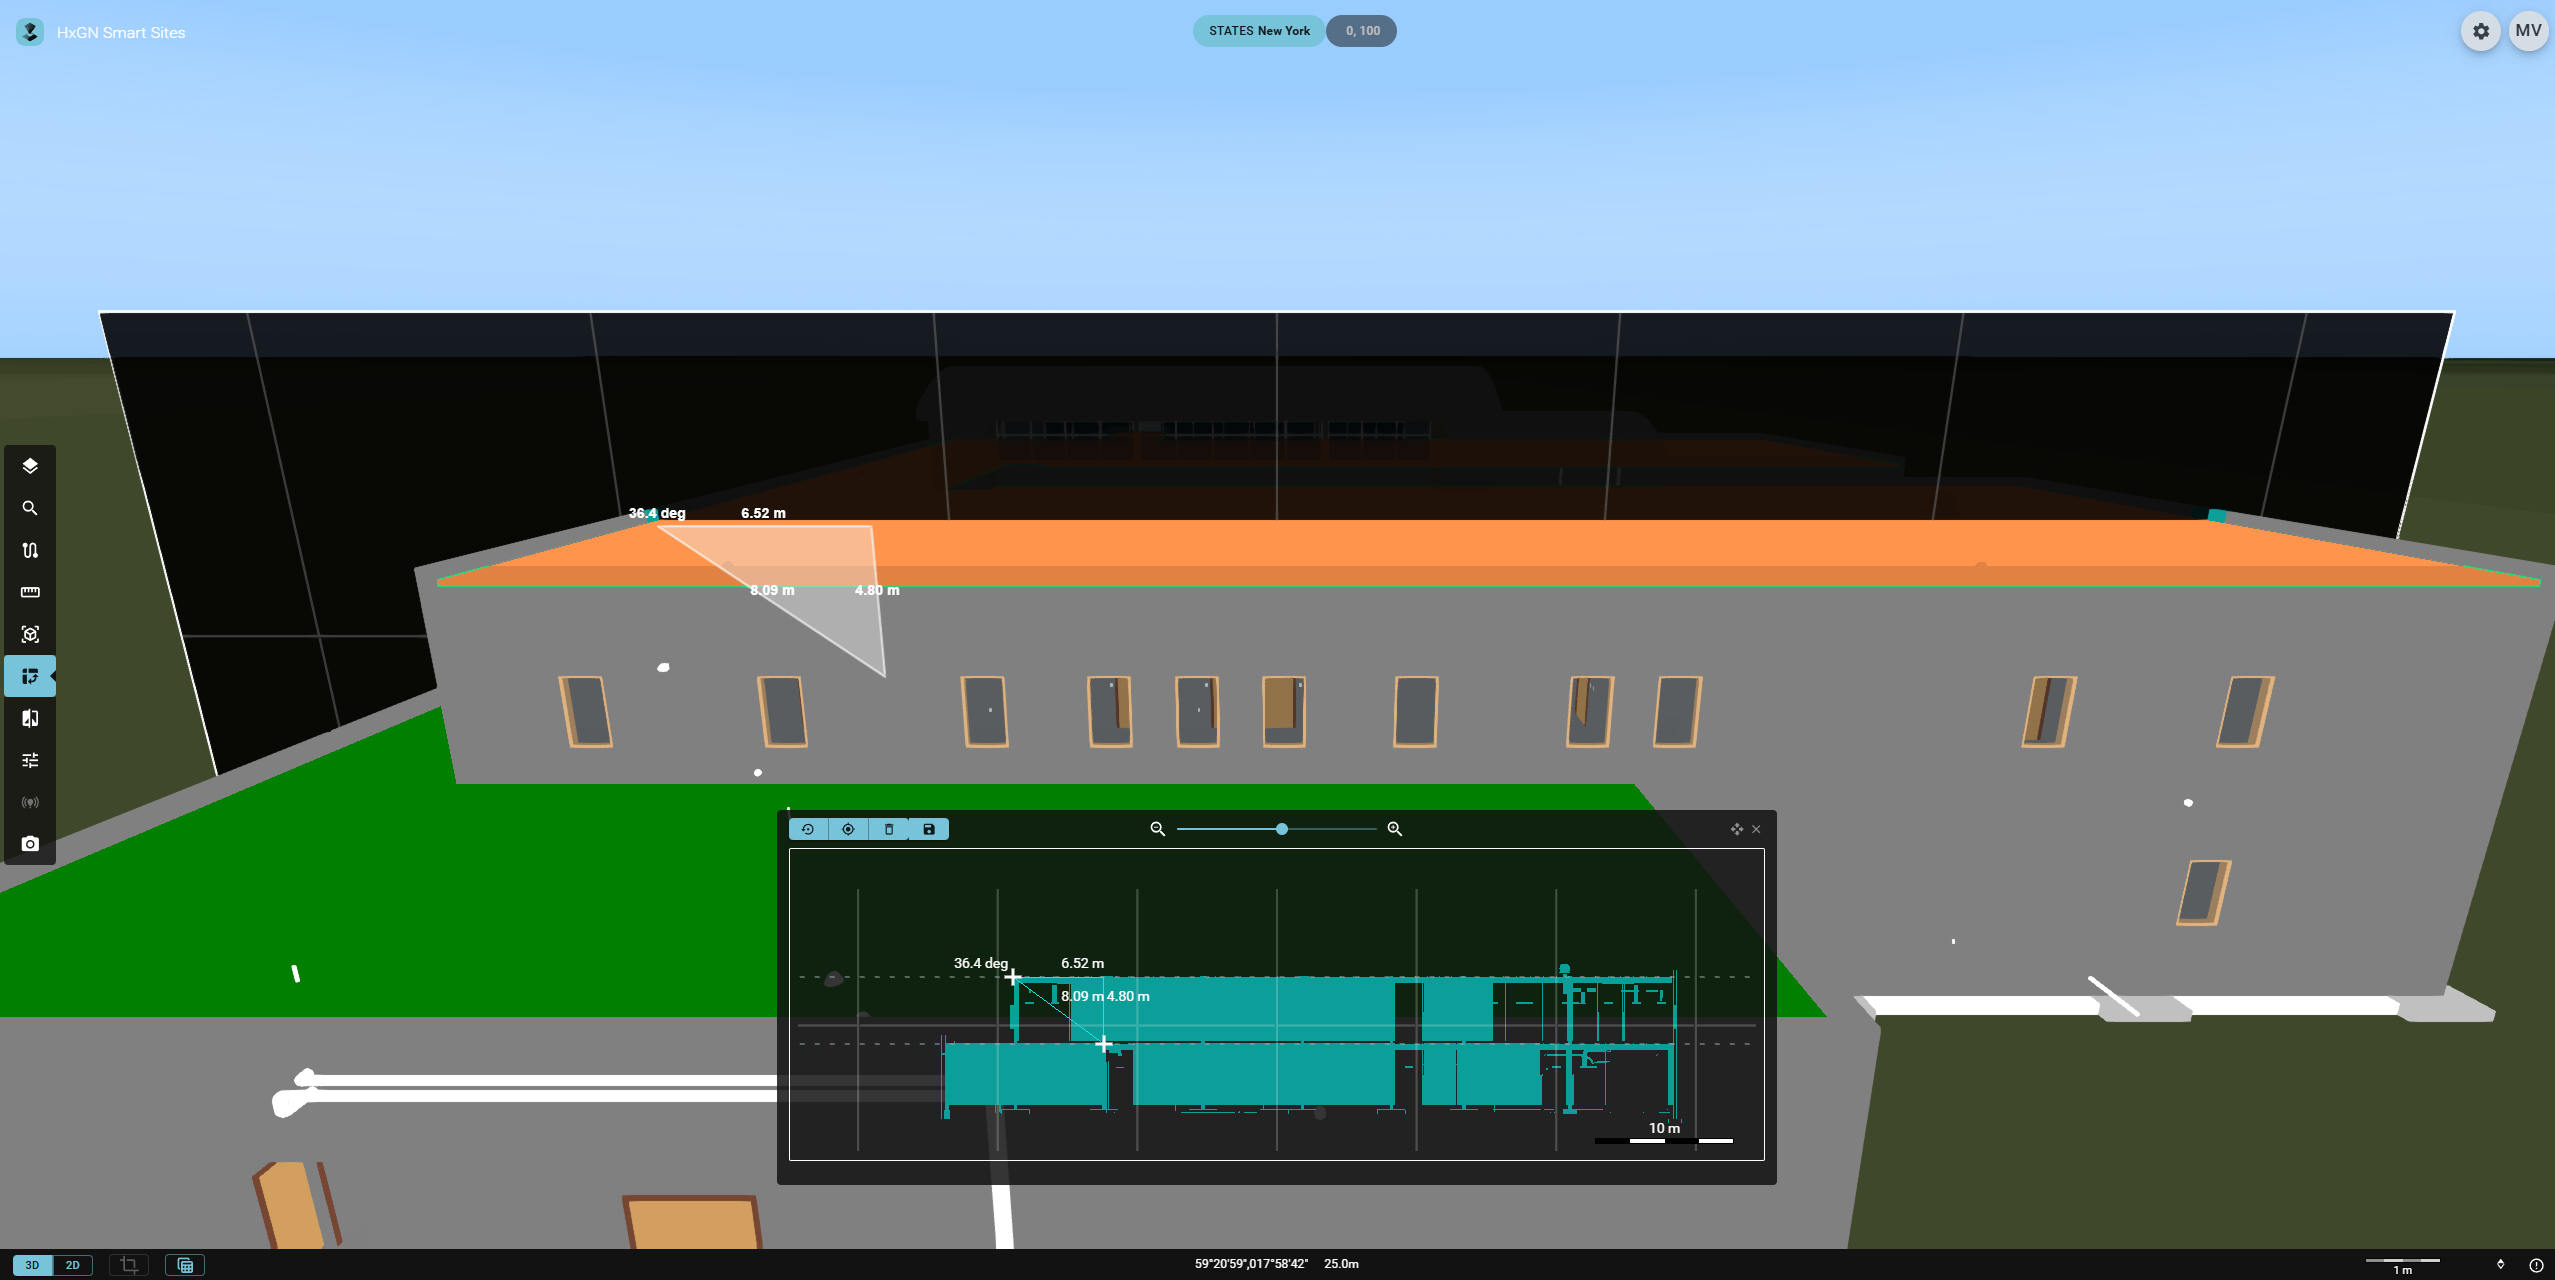
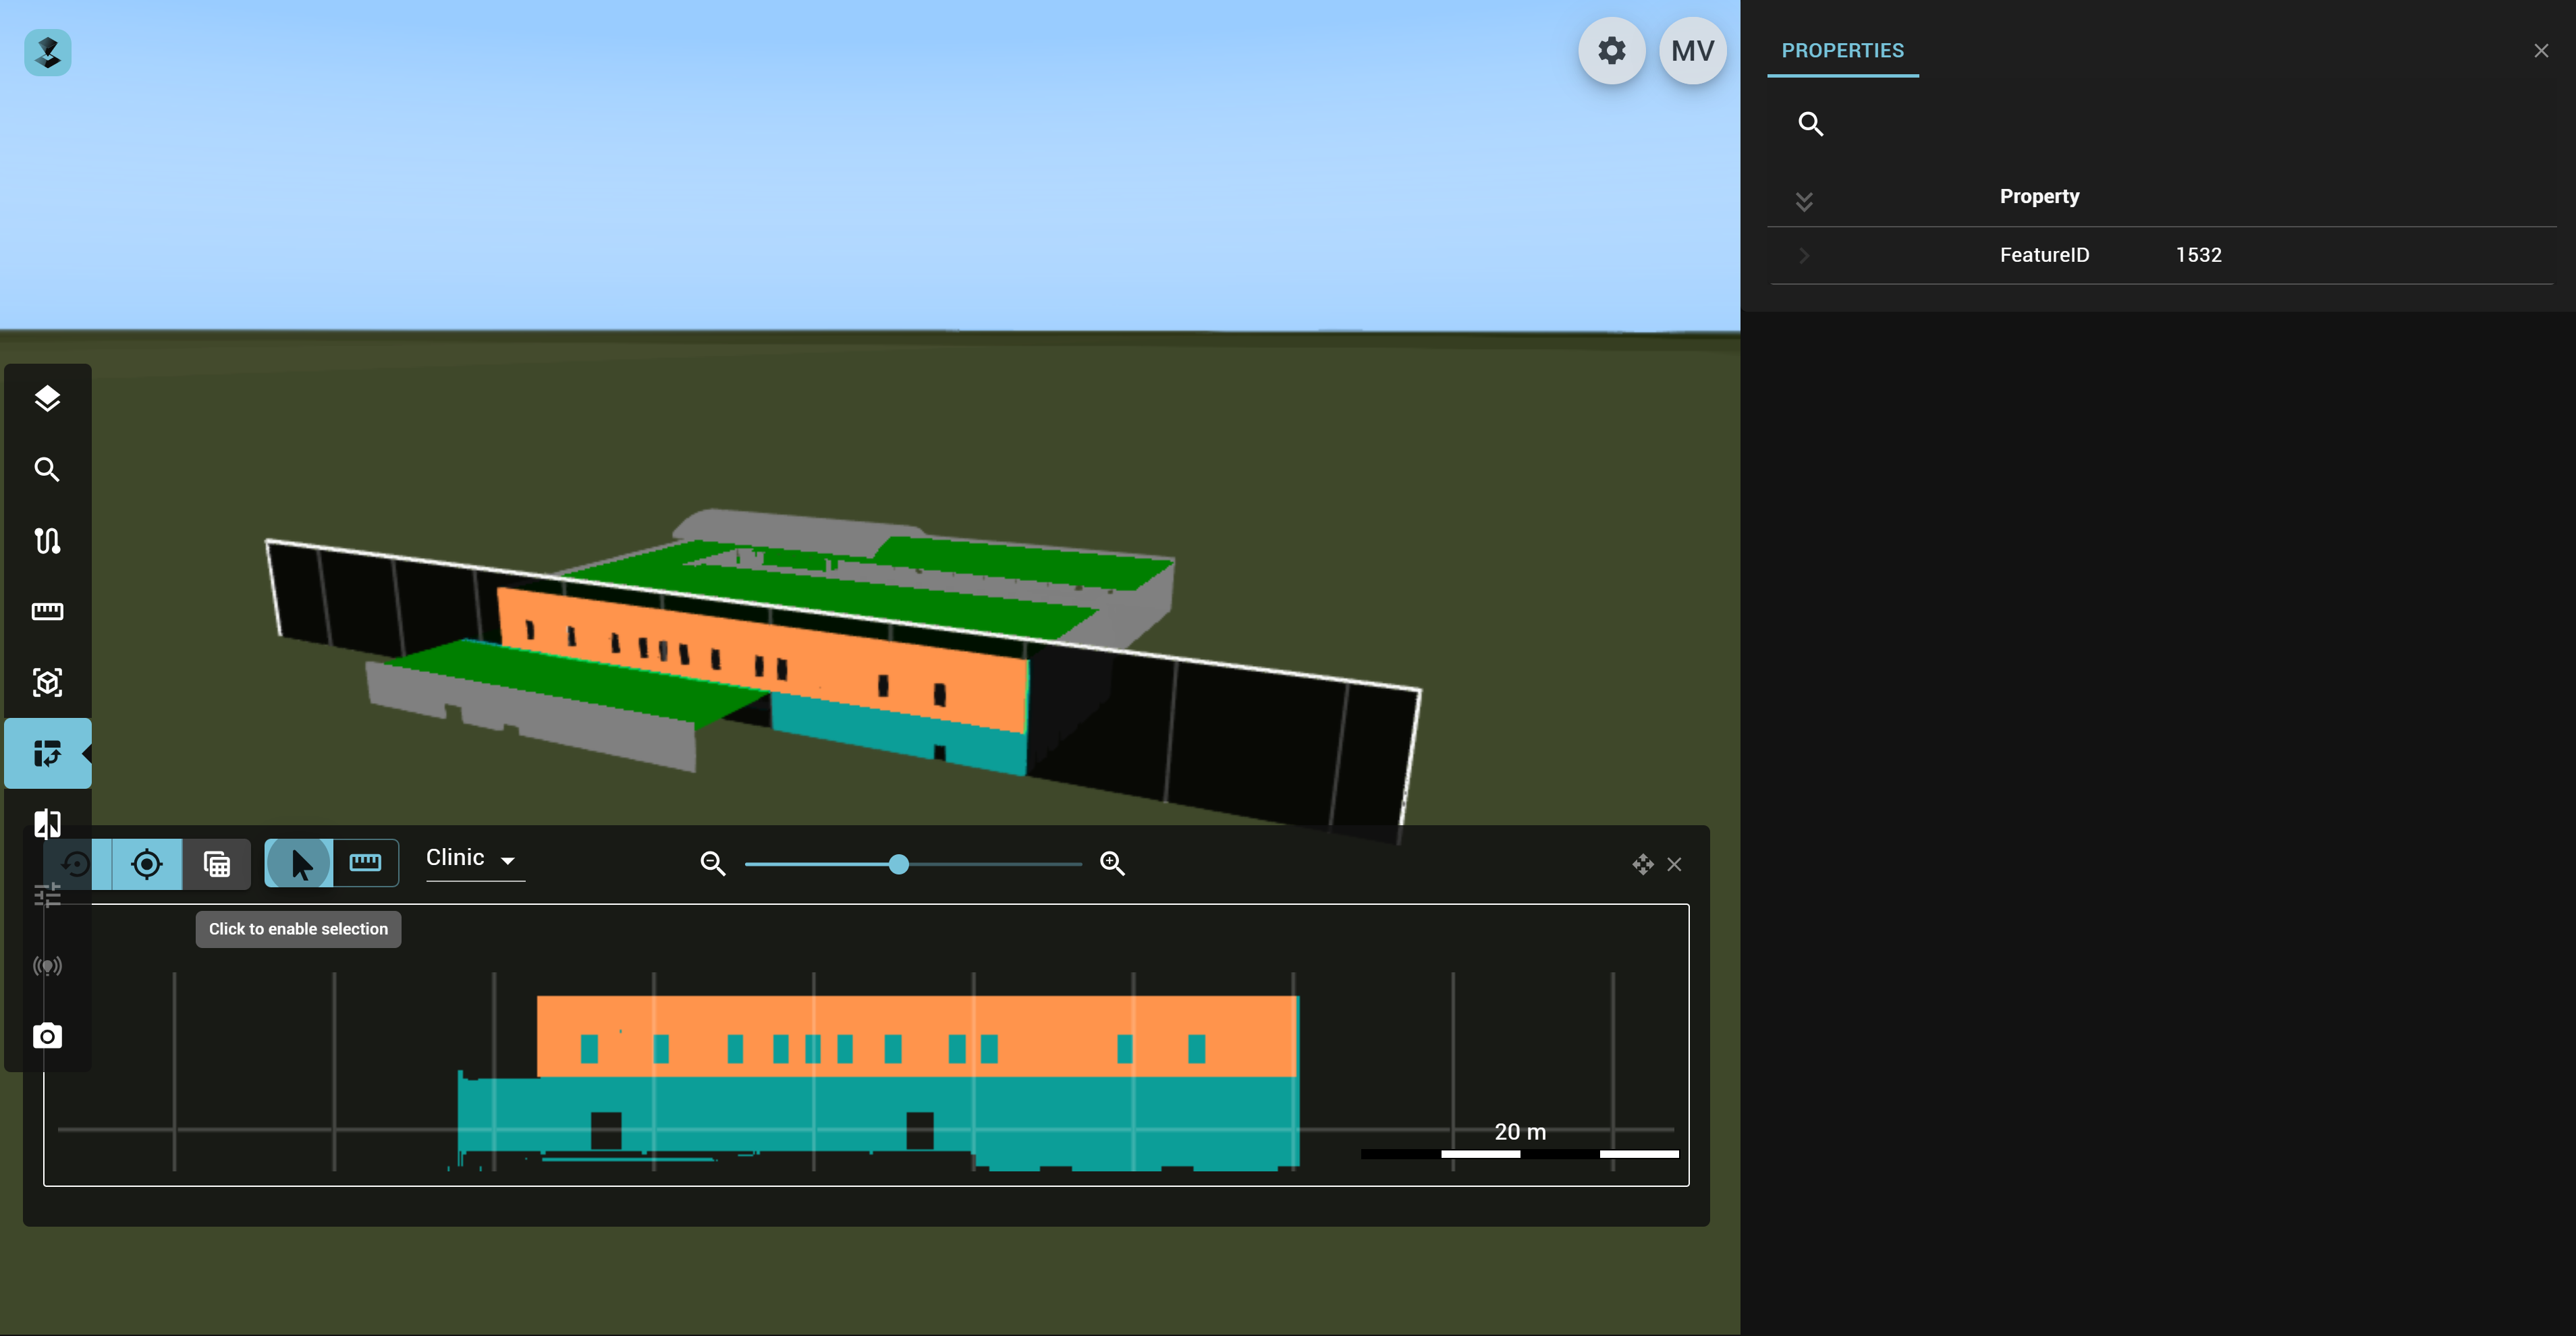
- Visualization of a cross-section: The cross-section is visualized on the cross-section view.
How to use the Cross-section controls
The Cross-section plane
Hover over the plane to activate the controls.
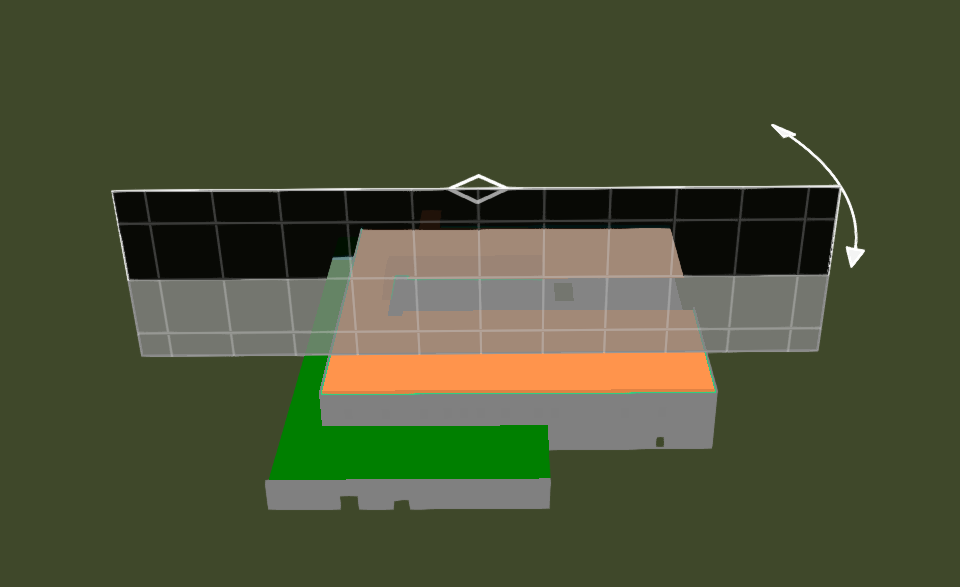
- Use the diamond at the top of the plane to move it horizontally across the map.
- Use the arrows at the top right of the plane to rotate it horizontally to the map.
The Cross-section view
- Create a new plane.
- Fit on the existing plane.
- Pop out the query results in the table view.
- Enable selection on the cross-section view.
- Enable cross-section measurement.
- Select the Publication to view in the cross-section using the dropdown button.
- Zoom in an out on the view using these buttons and slider, or use the mouse wheel on the view.
- Use the buttons in the top right corner of the Cross-section view to move the view around or exit the Widget.
- Click and drag in the cross-section view to drag the cross-section in any direction.
The cross-section plane displayed on the 3D map and its visualization in the Cross-section view are fully synchronized. Any adjustments made to one are immediately reflected in the other.
Cross-section query results
You can view a list of the model features contained in the cross-section.
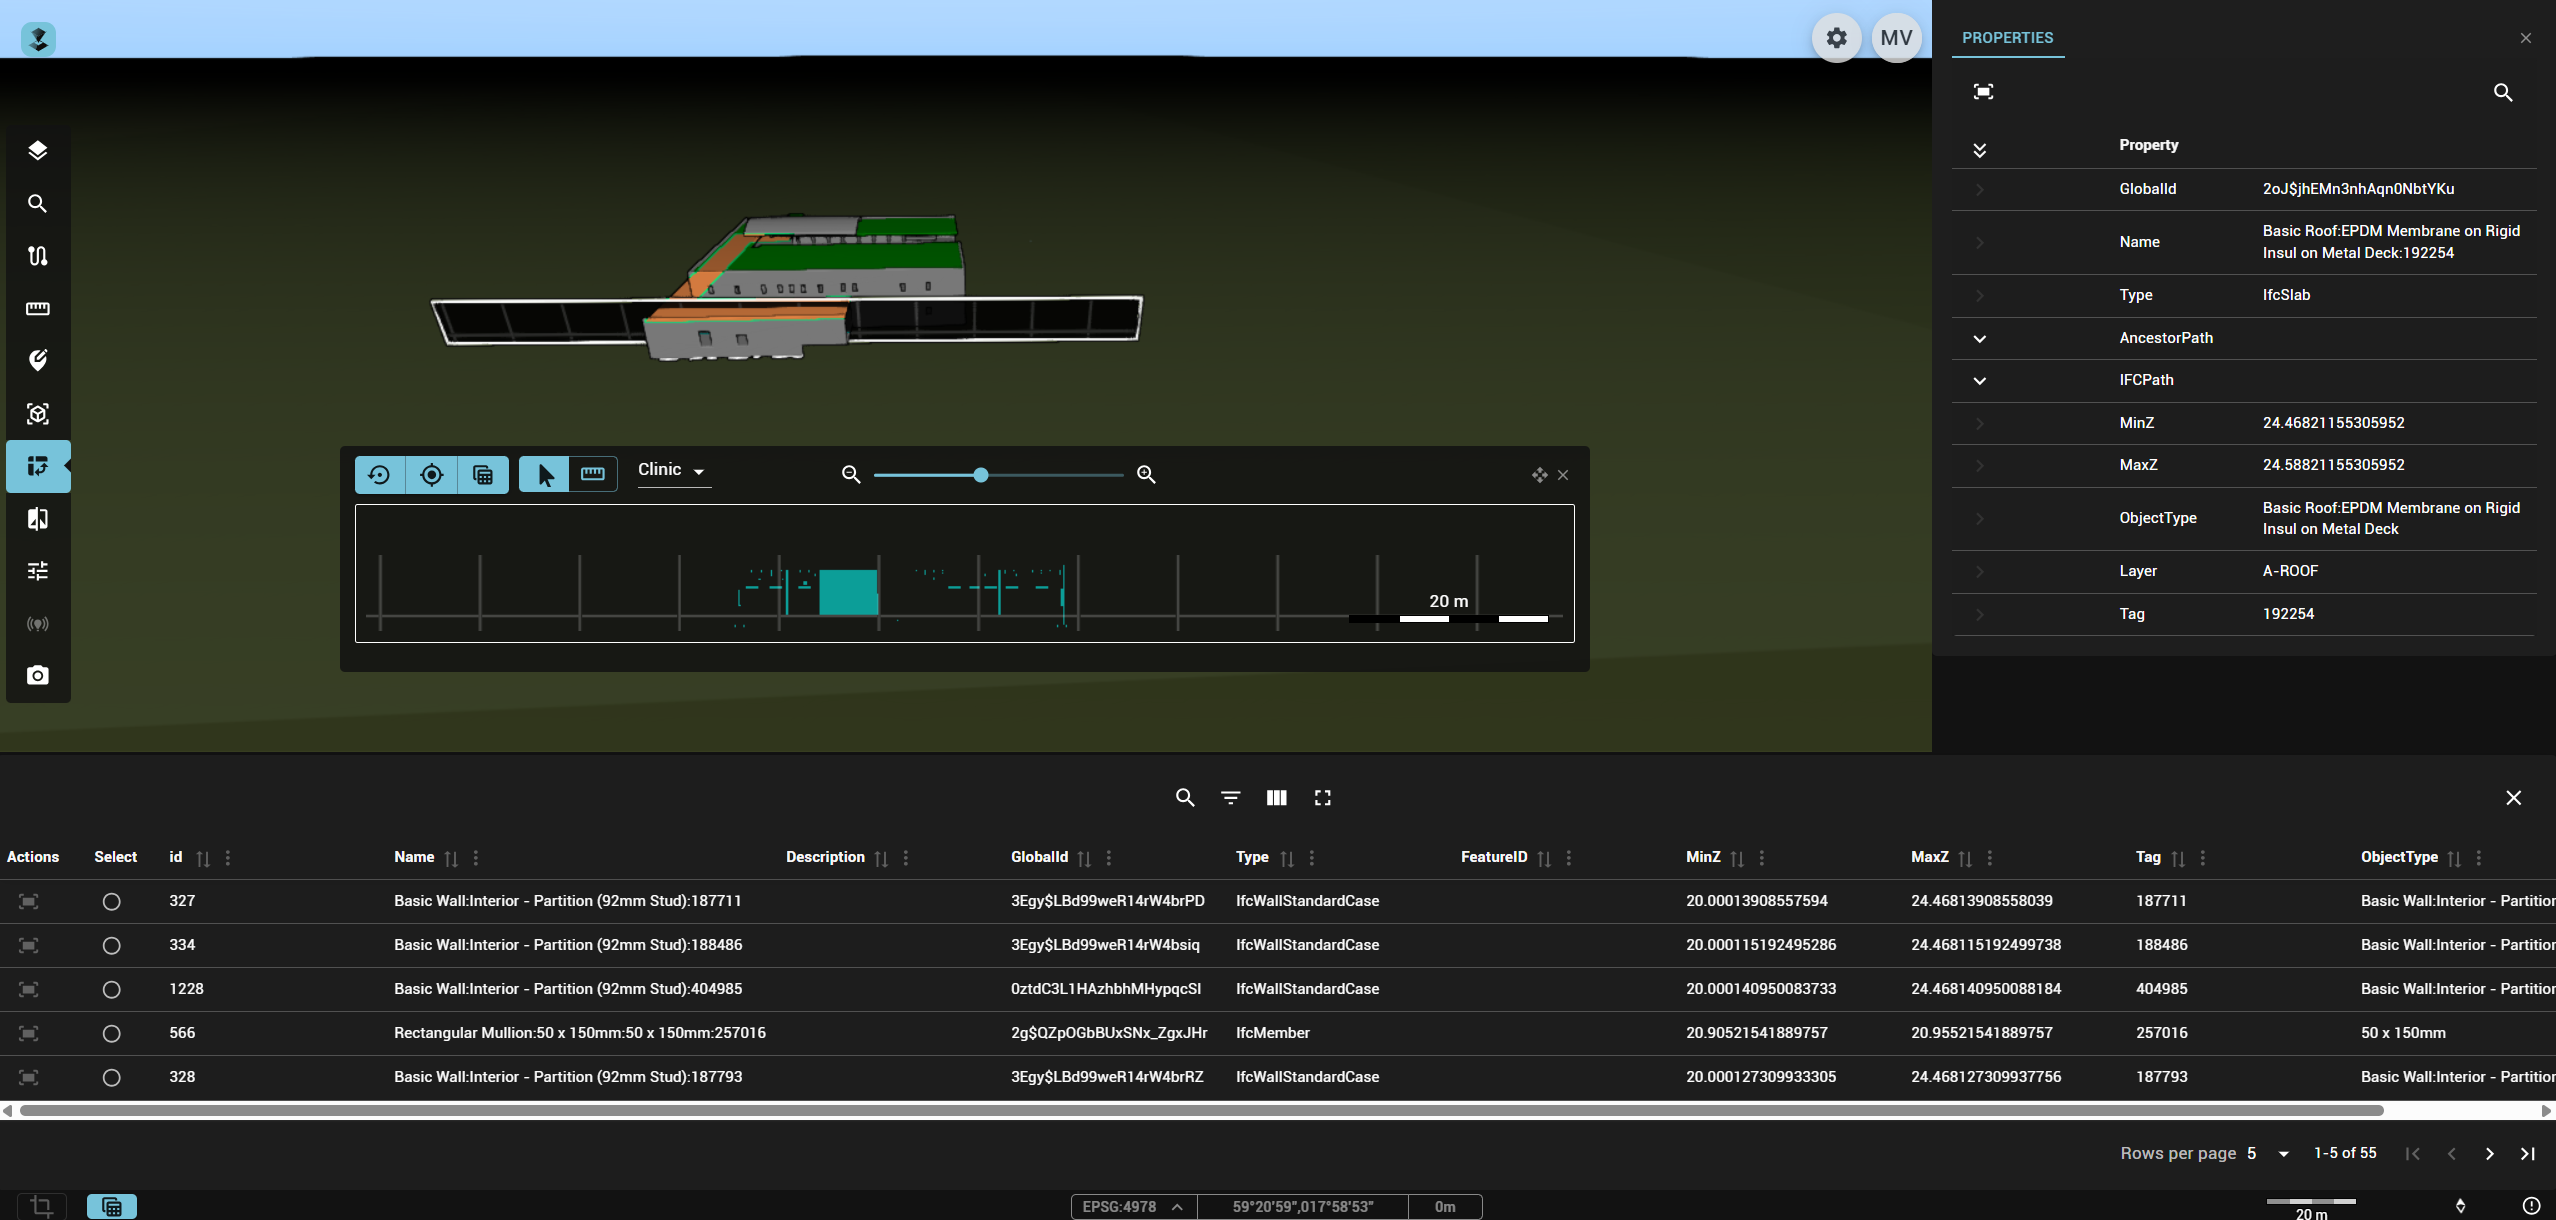
By default, the query results show the 10 most common properties per datasource in the columns.
You can interact with the results using the following:
general options
- Show/Hide search. Opens a search input to search across all listed properties. Use x to clear the search field.
- Show/Hide filters. Enables or disables a text filter per column.
- Show/hide columns in table. Displays the full list of available feature properties, allowing you to select which columns to show in the query results. Includes a search bar and an option to list only currently visible columns. Your selection is saved to local storage.
- Toggle full screen. Expands the query results panel to full screen or reverts it to docked mode. Adjust pagination to maximize usability in full-screen mode.
- Pagination. Adjust the number of rows displayed per page and navigate between the first, previous, next, or last page of results.
- Close panel. Exit the query results.
Row options
- Fit. Fits the map view to this model feature.
- Select Select the model feature in this row. The selection is reflected on the map, in the cross-section view and in the properties panel.
Column options
- Sort by name ascending/descending/off. Sorts the model features from the query results on this property in the selected order.
Cross-section selection
You can select features on the cross-section by clicking them. These features are then also selected on the map. The reverse is also true: if you select a feature on the map that is visible on the cross-section, it will be selected there also. As with all selection, this will trigger the properties panel.
Cross-section measurement
You make orthogonal measurements on the cross-section view by clicking two points. As before, this is also reflected on the cross-section plane. New icons become available
, allowing you to delete or save the measurement.